|
|
 |
|
Printable
version of this article in Adobe Acrobat Format

|
What Price O-Rings? Just
Time!
A tool manufacturer once asked me to consult with them on a
vacuum chamber "cleaning problem." They indicated the
cleaning problem prevented them from achieving the required system
pump-down times. The chambers were fabricated from 6061 aluminum.
The manufacturer was giving serious consideration to either machining
the chamber surfaces under a partial pressure of Ar and O2,
or using ethanol as a lubricant during machining. These measures
were reported by Ishimaru to yield very low aluminum outgassing
rates without bakeout (i.e.,
~10-10 torr-L/s cm2 after a few hours
of pumping). 1 An analysis of their pump-down data
made it evident that it wasn't a cleaning problem. Rather, they
had o-ring outgassing problems.
Why was this so evident? In an unbaked system, the outgassing
from both metal components and elastomers comprises primarily
H2O. Most materials in an unbaked vacuum
system have outgassing rates that vary according to the following
equation: 2
equation (1).
qm (t) = q1 x (t / t1)-
a
where
|
|
qm (t) =
|
the material outgassing rate as a function of time,
in torr-L/s-cm2,
|
|
q1 =
|
the material outgassing rate in torr-L/s-cm2 at
a time t1 of one hour,
|
|
t =
|
the pumpdown time,
|
|
a ~
|
1.0 for most metals, whereas,
|
|
a <
|
0.6 for most elastomers (i.e., Viton®, (3) Buna-N,
etc.).4
|
|
Of course times t1 and t must have the same units (i.e.,
either seconds, minutes, etc.). Intuitively one might expect a
for metals to vary drastically according to the surface conditions
of the metal. This usually isn't the case. For example, Schram reported
an a for anodized aluminum - a metal
sponge, if ever there is one - of 0.9, whereas for unbaked aluminum
he reported an a of 1.0.1 However,
q1 for the anodized aluminum is ~ 44 times greater than
that of the fresh or unbaked aluminum.
The total system outgassing rate is just A x
qm (t), where A is the material surface area . The value
A x qm (t) divided by the
system pump speed, S, near the vacuum gauge, yields Pm
(t), the system pressure as a function of time. Therefore, (1) can
be modified accordingly:
equation (2).
Pm (t) = P1 x (t / t1)-
a
By now you must be wondering what this all means. It means just
this: assume that the "free" gas in the vacuum system
is pumped away comparatively quickly, and it's an all-metal system.
The chamber pumpdown pressure as a function of time, if plotted
on log-log paper, will yield a slope of pressure v. time of approx.
-1. On the other hand, if the system has just a few elastomer sealed
components, only after an extended time, will a pressure v. time
slope of -0.5 to -0.6 be observed. If the system has a large number
of o-rings, the outgassing from the metal will be in the noise,
and the pumpdown slope will be -0.5 to -0.6 throughout time.
We are able to deduce this by taking the log of both sides of (2)
and solving for the value of a. That
is,
equation (3).
[log Pm (t) - log P1] ¸
[log t - log t1] = - a
|
| Metal
Outgassing
Let's take a look at some examples. Assume that you have an all-metal
system with a total surface area, A ~ 2 x 104 cm2,
and that the H2O pump speed delivered to the chamber
is ~ 3300 L/s. Figure 1 shows a calculated plot of system pressure
v. time on log-log paper for chambers constructed of both clean
and anodized (i.e., dirty) aluminum. Note that the initial slopes
of both pumpdown curves are approximately -1. The pumpdown curve
for the clean aluminum asymptotes at ~10- 8 torr. This
is because it was assumed that the blank-off pressure of the pump
(i.e., the ultimate or base pressure) was ~10- 8 torr.
Though the initial slopes of the two curves are almost the same,
the difference in calculated system pressures for the same time
differ by the factor of ~44 previously discussed. Using the values
of speed and surface area given in the figure, the reader should
be able to calculate an approximate value of q1 for both
types of aluminum.
|
|
|
|
O-Ring Sealed System
"But Kimo, I've got a system with both metal surfaces and elastomer
seals." No problem; the pumpdown curve will merely be the algebraic
sum (i.e., linear superposition) of the pressure due to the elastomer
outgassing in time and the pressure due to metal surfaces outgassing
in time.
De Csernatony showed that the equivalent outgassing surface area
of an o-ring in a groove comprises half of the total area of the
o-rings.6 On doing an inventory of the equivalent amount
of Viton used in the manufacturer's system, I was shocked to find
that it totaled ~2750 cm2. That is, the surface area
of o-rings in their systems totaled >10% of the system's metal
surfaces!
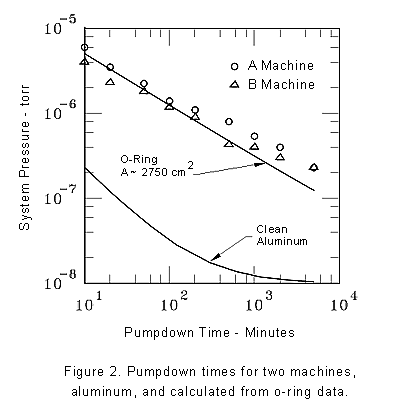
To clearly demonstrate to the manufacturer the source of the problem,
I plotted: i) actual system pumpdown rates; ii) the theoretical
pumpdown curve for Viton using reported data;4 and, iii)
the pumpdown rate to be expected for clean aluminum, all assuming
a 3,300 L/s pump speed. These findings are summarized in Fig. 2.
Note that though a's for the systems
were ~0.49, and ~0.59 for calculated pressure values based on the
Viton data, the pressure magnitudes tracked closely. Again, the
outgassing due to the clean aluminum chamber was negligible.
|
 |
|
Needless to say, the manufacturer was very displeased with the
findings. I suspect that they knew what the problem was when I walked
in the door, but were hoping for a silver bullet cure. They asked
if there was some manner in which they might treat the o-rings to
reduce the outgassing? This is no help, for it has been shown that
the sorption of air gasses and water vapor in o-rings is a completely
reversible process 24 hours after venting a vacuum system to air.4
Predicting System Outgassing
Using the simple models described it is possible to fairly accurately
predict system pumpdown pressure in time for any o-ring sealed,
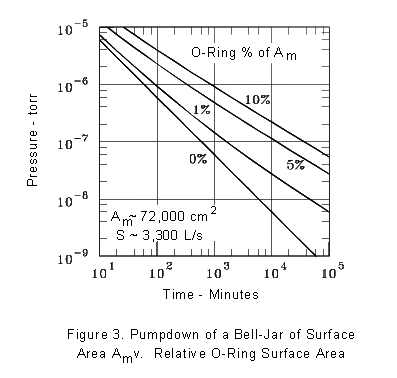
metal system. Figure 3 illustrates what is to be expected when pumping
down a 270 L bell-jar. The bell-jar has clean, internal sputter-shields
which have the effect of increasing the internal metal surface area
of the bell-jar, Am, by a factor of three. It was assumed
that the blank-off pressure of the pump for water vapor was 10 -
11 torr. This is not unreasonable for a cryopump. Also, if
a cross-over pressure of ~0.1 torr is used, and a cryopump air speed
of 1,200 L/s assumed, the air gases in the system will be removed
in seconds.
|
 |
|
If you lay a straightedge along side of the 1% and 5% data, you
will see that they curve, and that their slopes are decreasing in
time. This is because the dominant source of outgassing in time
is becoming that of the o-rings. The 10% data are almost totally
dominated by o-ring outgassing.
Conclusions
4 Analysis of the slopes of vacuum
system pumpdown curves can be very instructive.
4 The blank-off pressure of the pumps
must be considered in the slope analysis.
4 One can accurately predict the
effect o-rings have on system pumpdown times.
4 The sorption of air gases in o-rings
is a completely reversible process.
4 What price o-rings? Just time!
Reference
1 Ishimaru, H., J. Vac. Sci. Technol. A7 (3), 2439 (1989).
2 O'Hanlon, J.F., A User's Guide to Vacuum Technology, 2nd Ed.
(John Wiley & Sons, New York, 1989), p. 445.
3 A registered trademark of E.I. du Pont Nemours and Company.
4 Welch, K.M, McIntyre, G., Tuozzolo, J.T., et al, Vacuum 42 (7-9),
1924 (1990).
5 Schram, A., LeVide No 103, 58 (1963).
6 de Csernatony, L., Crowley, D.J., Vacuum 17 (10) ,551 (1967).
© Copyright Kimo M. Welch February 2000.
|
|

